React Charts Performance Comparison: Which One Wins?
- Author:Hashtrust Technologies
- Published On:Jul 27, 2023
- Category:Comparison
Objectives Of The Comparison
The Objective of this comparison is to find the fastest library for plotting a defined number of data points.
Charts are a required component in almost every project now, and there are dozens of libraries to choose from. It's tough to find the best one for your use case.
I'm writing this blog to share the research I've done to find the best library for performance in my own use case.
I am going to compare the top three libraries from my filtered list of ten. I have already set some requirements for my client that helped me narrow it down to these three. (I will try to cover that on another blog.)
Chart Types and Variety (Beyond Performance)
When selecting a charting library, it's crucial to look beyond mere performance metrics and consider the variety of chart types, including a wide range of chart types the library offers. Each visualization conveys data uniquely, and the ability to choose from a diverse range of charts can enhance the understanding of complex datasets. For instance, libraries like ReCharts excel in not only rendering standard bar and line charts but also offer innovative options like radial and scatter plots. ApexCharts, on the other hand, provides impressive support for dynamic and animated charts, elevating user engagement. HighCharts similarly stands out with its comprehensive array of chart types, including sophisticated 3D and hybrid visualizations. By evaluating not just speed but also the variety and flexibility of chart types available, developers can select the library that not only meets their performance needs but also supports their data storytelling effectively. Moreover, the compatibility of these chart types with responsive design ensures that users have consistent experiences across devices, making it an important factor to weigh in your final decision.
Customization and Styling Capabilities
When it comes to customizing and styling charts, the choice of library can make a significant difference in how effectively you can tailor the visual presentation of your data. Libraries like ReCharts offer a robust API that allows developers to customize almost every aspect of a chart, including adding custom components, from colors and fonts to axis styles and grid lines, enabling a perfect fit for any branding or design requirements. ApexCharts takes this a step further with its advanced theming capabilities, giving users the ability to create visually stunning, uniform styles across multiple charts with minimal effort. HighCharts also provides a wide array of styling options, allowing for fine-tuned customization of chart elements, making it an excellent choice for applications where aesthetics are as important as functionality. By prioritizing a library’s customization and styling abilities, developers can ensure that their data visualizations not only convey information effectively but also resonate with the overall design ethos of their projects.
Parameters Of The Test
We will be plotting two graphs using each library one by one, where one graph will contain 1K chart data points and the other will contain 5K data points and then we will see how much time the browser takes to render that component!
We had one more use in the project where we need to plot two area graphs and one line graph simultaneously using Apache ECharts. So, for this testing we will follow the same approach, which means effectively we will be plotting two graphs for 3K and 15K data points.
Device Configuration
This testing in performed on the Devicewith following configuration:
- Processor: i5 12th Generation
- Ram: 16 GB
- Storage Type: SSD
Recharts
Example with 1000 data points

Example with 5000 data points

Apex Charts


HighCharts


I was surprised to see that HighCharts is performing so well, so I decided to test it with a lot of data points, specifically 1L data points. I expected it to struggle with 3L data points because of the three graphs (Area, Area, Line), but it actually performed quite well. It's almost equal to what we see in other libraries with 10K data points. See the screenshot below:

100000 data points
Recap of everything
| Charts | Render Time (1000 points) | Render Time (5000 points) | Render Time (100000 points) |
|---|---|---|---|
| ReCharts | 2677ms | 5398ms | • |
| ApexCharts | 1865ms | 5284ms | • |
| HighCharts | 565ms | 723ms | 5405ms |
Other Factors
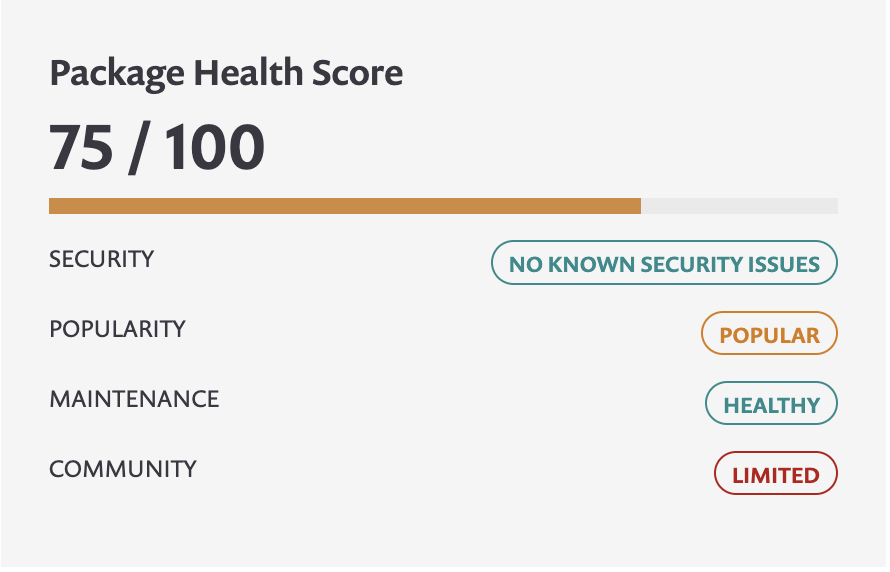
Here are a few other key factors which I usually check out before picking out any library that I will be using for my projects -
NPM Monthly Downloads
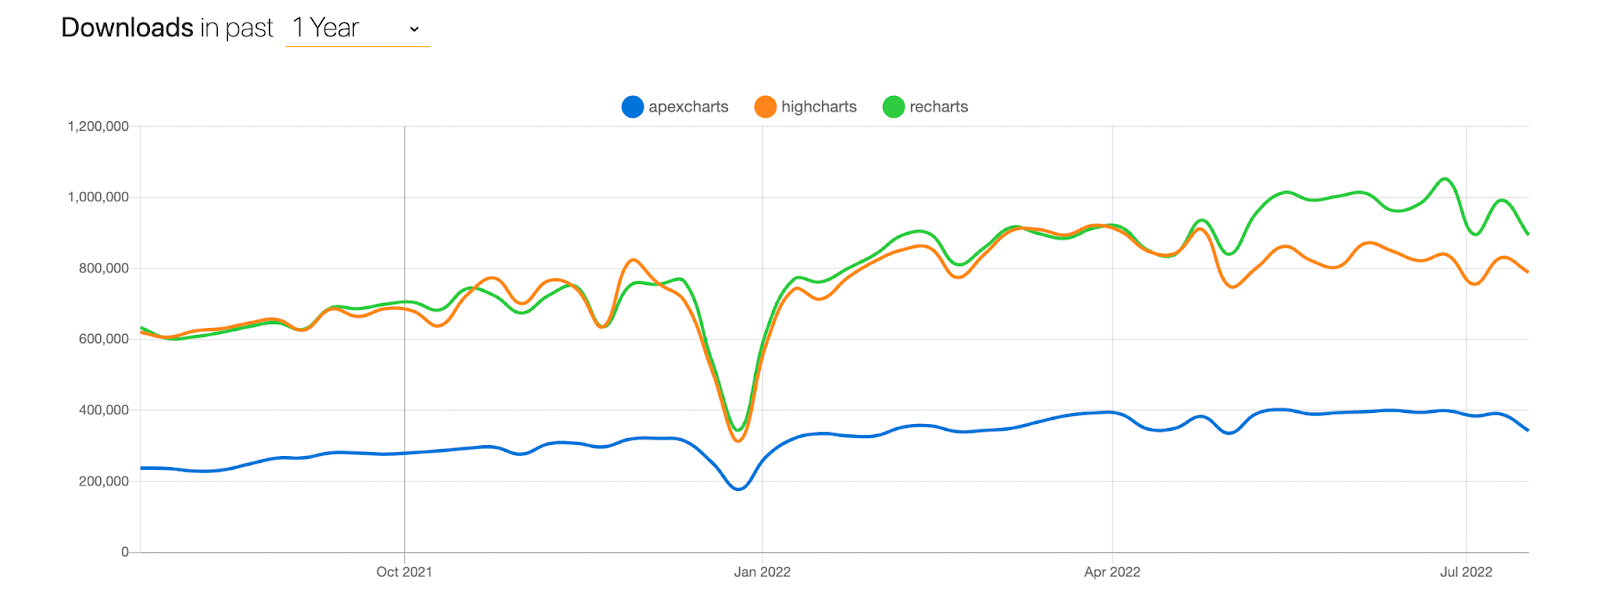
As we can see that in the graph above, recharts and highcharts have the most number of downloads in the previous year.
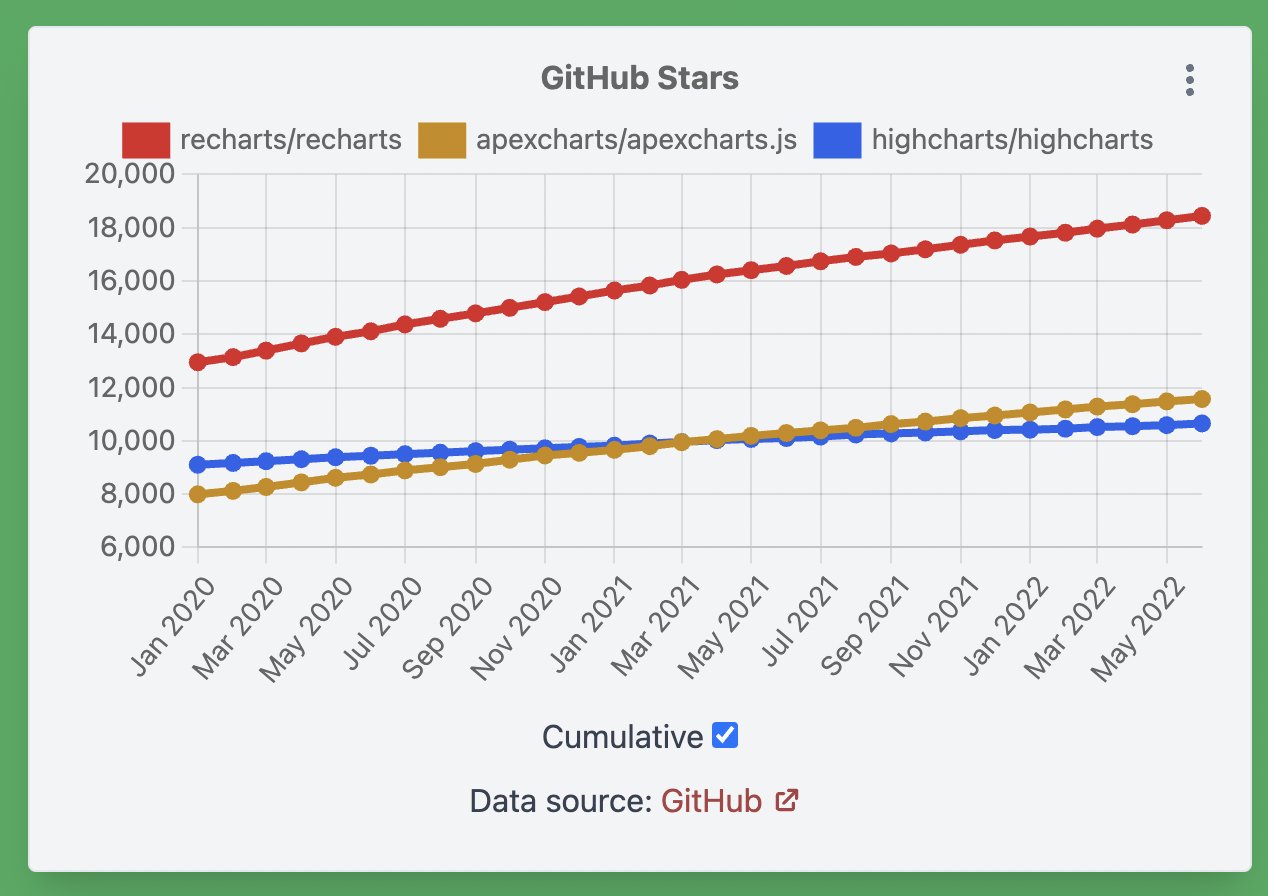
Github Stars
Health Score
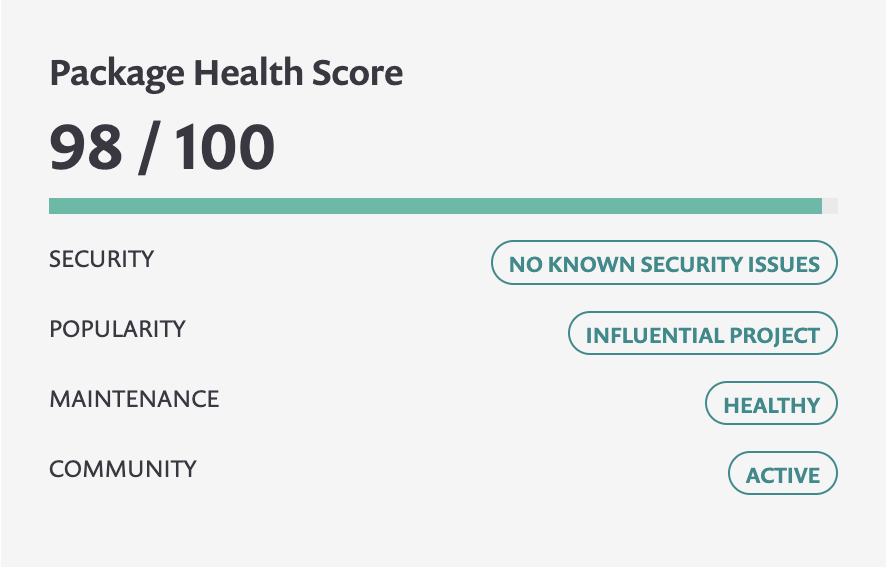
Recharts | ApexCharts | HighCharts
Advanced Features (Zoom, Pan, Export, Multiple Axes)
When considering a charting library for your React application, it's essential to evaluate advanced features and interactive features that can significantly enhance user interactivity and data utility. Features such as zooming, panning, exporting, and the ability to handle multiple axes can be game-changers in providing an enriched user experience. For instance, libraries like HighCharts shine with their comprehensive zoom functionality, allowing users to focus on specific data ranges without losing the overall context. Additionally, regression and pan features facilitate smooth navigation across extensive datasets, making it user-friendly, especially for complex visualizations. ApexCharts also stands out in providing robust exporting capabilities, empowering users to download charts in various formats, from PNG to PDF, which is invaluable for reporting and presentations. Lastly, the support for multiple axes ensures that users can compare different datasets effectively, as they can visualize varying metrics on a single graph without confusion. By prioritizing libraries that offer these advanced features and interactive features, developers can greatly enhance the analytical power and user engagement of their applications.
Real-Time & Interactive Capabilities
In today's fast-paced data environment, real-time and interactive capabilities are essential features for any charting library that aims to enhance user engagement and provide immediate insights. Libraries such as ApexCharts and HighCharts excel in this domain by enabling developers to create dynamic charts that update in real time as the underlying data changes. This is particularly valuable for applications that monitor live data streams, such as finance dashboards or IoT sensor monitoring, where timely data representation can drive critical decision-making. Furthermore, interactivity features like tooltips, zooming, and clickable elements allow users to delve deeper into the data, providing a more enriched experience. For instance, HighCharts allows users to select specific date ranges and instantly view corresponding data points, while ApexCharts supports smooth transitions during data updates, making it an ideal choice for developers who want to create intuitive and responsive user interfaces. By choosing a library that emphasizes these real-time and interactive functionalities, developers can create data visualizations that are not only informative but also foster greater user interaction, ensuring that the charts serve as powerful analytical tools in their applications.
Pricing and Licensing Details
When selecting a charting library for your React projects, understanding the pricing and licensing details is paramount, as these factors can significantly influence your decision-making process. Several libraries offer different licensing models, with some providing free and open-source options while others operate under a commercial licensing structure. For instance, ReCharts is an open-source library available under the MIT license, which allows you to use it freely in any project, commercial or otherwise. On the other hand, HighCharts operates on a dual license model; it offers free usage for non-commercial projects, but requires a paid license for any commercial applications or if you want to access their enterprise features. ApexCharts, similarly, provides a free version under the MIT license while offering a premium version with advanced features and additional support through a commercial license. Additionally, if you're considering a versatile solution, you might look into a React wrapper for charting libraries to simplify integration. It's crucial to carefully consider your project's scope, budget, and the features required when evaluating these licensing options, ensuring you choose a library that aligns with both your technical and financial needs. Always check for any hidden costs associated with support or advanced features, as this can have an impact on the long-term expenses of your project.
How do I make my charts responsive across devices?
To make your charts responsive across devices in React, utilize libraries like Recharts or Chart.js that support responsive design, including features for a react line chart. Implement CSS media queries and set chart dimensions to percentages rather than fixed values. This ensures charts adapt seamlessly to various screen sizes, enhancing user experience on all devices.
Community and Support
When selecting a charting library, the level of community support and active maintenance can significantly impact your development experience and project longevity. A strong community often translates to quicker resolutions of issues, a wealth of shared resources, and consistent updates that keep the library aligned with new technologies and best practices. Libraries like ReCharts and HighCharts benefit from substantial user bases, where extensive documentation, tutorials, and community forums thrive. This means that if you encounter a roadblock, it’s likely that someone else has faced the same challenge, and solutions or workarounds are readily available. ApexCharts similarly boasts an engaging community, where contributors actively participate in discussions and feature requests, ensuring the library continues to evolve based on user feedback and providing seamless integration throughout its use. Ultimately, investing in a library with a vibrant community not only enhances immediate troubleshooting capabilities but also assures you that the tool will stay relevant and well-supported in the long run, allowing you to focus more on development and less on overcoming obstacles.
Supported Features (Labelling, Tooltips, Legends, Axis)
When evaluating a charting library for your React project within the react ecosystem, it's crucial to consider the supported features that enhance data interpretation and user interaction, particularly labeling, tooltips, legends, and axes management. Libraries like ReCharts and ApexCharts offer extensive labeling options, allowing developers to customize how data points are presented, leading to clearer and more informative visuals. Tooltips play a pivotal role in user engagement by providing real-time data insights as users hover or click on different chart elements; HighCharts excels in this area with its sophisticated tooltip configurations that can include rich HTML content for better context. Furthermore, effective legends are essential for helping users navigate complex datasets, and libraries such as ApexCharts provide customizable legend placement and functionality, thus improving the readability of the chart. Axes management also deserves attention; ensuring that tracks like logarithmic scales or dual axes are supported can make a significant difference in how well data is conveyed. By prioritizing these supported features, developers can create charts that not only look good but also deliver a user-friendly and informative experience.
Cross Platform Support
When evaluating charting libraries for contemporary web applications, cross-platform support emerges as a vital consideration. Ensuring that your charts display seamlessly across various devices and operating systems can elevate user experience and broaden the audience reach. Libraries such as HighCharts and ApexCharts offer a wide range of chart types and have made considerable strides in this area, providing features that adapt dynamically to different screen sizes and resolutions, thus maintaining visual integrity. For example, both libraries support responsive design principles, optimizing charts for mobile devices without compromising functionality or aesthetics. Furthermore, the ability to integrate with frameworks like React Native allows developers to extend their charts beyond web applications into mobile app environments, providing a unified experience across platforms. This versatility not only enhances accessibility for users but also simplifies development efforts, as the same library can be leveraged in multiple contexts. By prioritizing cross-platform support in your charting library selection, you can ensure that your data visualizations are both effective and accessible, catering to a diverse range of users and use cases.
Planned/Future Chart Types and Features
As the landscape of data visualization and data structures continues to evolve, it is crucial for charting libraries to not just keep pace but also anticipate future trends and user needs. One of the most exciting areas of development is the incorporation of interactive and immersive chart types. For instance, 3D visualizations, along with augmented and virtual reality experiences, could transform how users engage with complex datasets. Features like smart annotations and AI-driven insights are also on the horizon, which will enable developers to provide users with data context at a glance, thereby enhancing comprehension. Moreover, as collaboration tools gain relevance, libraries may integrate functionalities that allow users to create and share visualizations in real-time, fostering teamwork and collective analysis. Additionally, the demand for compatibility with machine learning frameworks suggests that future libraries might include features for predictive analytics, enabling users to visualize outcomes based on historical data trends. With these planned advancements, the next generation of charting libraries promises not only to enhance functionality but also to empower users through innovative ways to interpret and interact with data.
References:
https://snyk.io/advisor/npm-package/recharts
https://snyk.io/advisor/npm-package/apexcharts
https://en.wikipedia.org/wiki/Comparison_of_JavaScript_charting_libraries
Conclusion
The best library for me and my current requirement is HighCharts. However, it's important to remember that what works best for me might not work best for you. ApexCharts & ReCharts have a lot of features that HighCharts doesn't offer, which could be an advantage for some people.
We at Hashtrust have an expert team of ReactJS developers and if you want to add charts to your web project then you can contact us!. Our experienced team of developers will give you the best assistance as per your needs.
